There’re myriad options out there to help monitor applications in real-time, and take preventive/corrective actions and/or notify operations teams. Attributes of interest could be anything from system APU utilization, to memory consumption, to application functional metrics. Any such system should have components playing these roles:
- Metric Collector
- Metric Storage
- Exception Analyzer/Detector
- Exception Notifier/Alerter
There’re products which do one or more of above – StatsD, FluentD, Elasticsearch, InfluxDB, Grafana, Hipchat, Slack, Alerta and many-many more. You could plug n’ play most of those with one another. DevOps teams are expected to prototype, assess and choose what works best. I’m going to discuss one such bag of products, which is easy to setup, and could be used if your apps are on-premises or in cloud:
- Telegraf – Metric Collector
- AWS Cloudwatch Metrics – Metric Storage
- AWS Cloudwatch Alarms – Exception Analyzer
- Hipchat/Slack – Exception Notifier
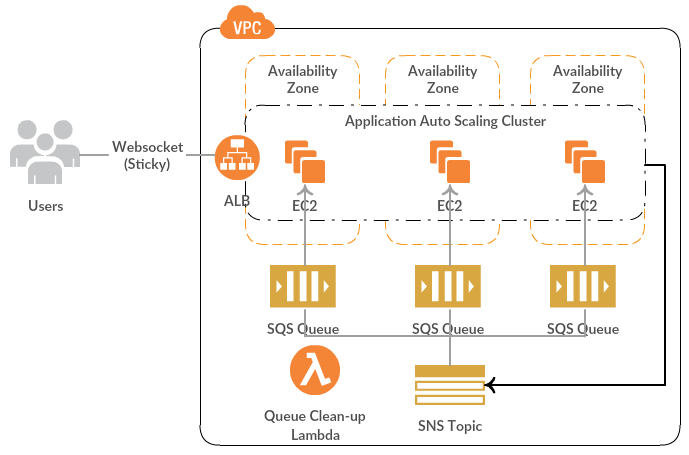
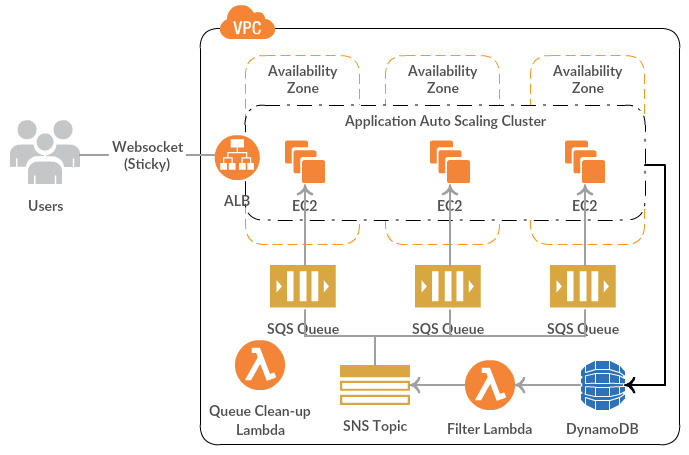
Setup looks like this for a autoscaling Spring Boot app on AWS:

Telegraf is a agent-styled process written in Go, which can collection different metrics using configured plugins. There’re input plugins to collect data, processor plugins to transform collected data, and output plugins to send transformed data to a metric storage. Architecture is very much similar to how Logstash, Flume or almost any other collector works. Since our application is deployed on AWS, a configured Cloudwatch agent is already collecting metrics like CPU Utilization, Disk & Network Operations, Load Balancer healthy host count etc. AWS doesn’t measure EC2 memory usage or Disk utilization by default, so we use Telegraf for that purpose and more:
- JVM Metrics via Jolokia – via Jolokia input plugin. Setting up Jolokia for a Spring Boot app is a matter of minutes.
- Java process availability – via Procstat plugin, which basically does pgrep to check if a process is alive. There’re other plugins to achieve this though.
And then Cloudwatch output plugin is configured to send all data to AWS Cloudwatch. A Telegraf agent runs on each EC2 instance of our Autoscaling group – which could be configured as part of a custom AMI, or setup as part of a Cloudformation template. A sample Telegraf configuration looks like this. This is how we configured it for Jolokia and Procstat specifically (as collectors.conf at /etc/telegraf/telegraf.d/):
[[inputs.jolokia]]
 context = "/manage/jolokia/"
 name_prefix = "my_"
 fielddrop = ["*committed", "*init"]
[[inputs.jolokia.servers]]
 host = "127.0.0.1"
 port = "8080"
[[inputs.jolokia.metrics]]
 name = "heap_memory_usage"
 mbean = "java.lang:type=Memory"
 attribute = "HeapMemoryUsage,NonHeapMemoryUsage"
[[inputs.jolokia.metrics]]
 name = "thread_count"
 mbean = "java.lang:type=Threading"
 attribute = "ThreadCount,DaemonThreadCount"
[[inputs.jolokia.metrics]]
 name = "garbage_collection"
 mbean = "java.lang:type=GarbageCollector,*"
 attribute = "CollectionCount,CollectionTime"
[[inputs.jolokia.metrics]]
 name = "class_count"
 mbean = "java.lang:type=ClassLoading"
 attribute = "LoadedClassCount"
[[inputs.jolokia.metrics]]
 name = "metaspace"
 mbean = "java.lang:type=MemoryPool,name=Metaspace"
 attribute = "Usage"
[[inputs.procstat]]
 name_prefix = "my_"
 pattern = "my-xyz-boot.jar"
 fieldpass = ["pid"]
And that’s what Cloudwatch output configuration looks like (as metricstorage.conf at /etc/telegraf/telegraf.d/):
[global_tags]
 InstanceId = "i-xxxxxyyyyyzzzzzzz"
 VPC="myvpc"
 StackName="my-xyz-stack"
[[outputs.cloudwatch]]
 region = "us-east-1"
 namespace = "MY/XYZ"
 namepass = [ "my_*" ]
 tagexclude = [ "host" ]
[[outputs.cloudwatch]]
 region = "us-east-1"
 namespace = "MY/XYZ"
 namepass = [ "my_*" ]
 tagexclude = [ "host", "InstanceId" ]
Of course, one could play around with different options that each plugin provides. It’s recommended to specify your own namespace for Cloudwatch metric storage, and configure the tags which would end up as dimensions for categorization.
Telegraf is a effective data collector and has got a great plugin support, but after all it’s another piece of software to run and manage. There’s a bit-invasive alternative to post your JVM and other functional metrics to Cloudwatch, if you’ve a Actuator-enabled Spring Boot application. Simply import the following libraries through Maven or Gradle:
// Gradle example
compile group: 'com.ryantenney.metrics', name: 'metrics-spring', version: '3.1.3'
compile group: 'com.damick', name: 'dropwizard-metrics-cloudwatch', version: '0.2.0'
compile group: 'io.dropwizard.metrics', name: 'metrics-jvm', version: '3.1.0'
And then, configure a metrics publisher/exporter, which uses DropWizard integration with Spring Boot Actuator under the hood:
...
...
import org.springframework.context.annotation.Configuration;

import com.amazonaws.services.cloudwatch.AmazonCloudWatchAsync;
import com.codahale.metrics.Metric;
import com.codahale.metrics.MetricRegistry;
import com.codahale.metrics.MetricSet;
import com.codahale.metrics.jvm.GarbageCollectorMetricSet;
import com.codahale.metrics.jvm.MemoryUsageGaugeSet;
import com.codahale.metrics.jvm.ThreadStatesGaugeSet;
import com.damick.dropwizard.metrics.cloudwatch.CloudWatchMachineDimensionReporter;
import com.damick.dropwizard.metrics.cloudwatch.CloudWatchReporterFactory;
import com.ryantenney.metrics.spring.config.annotation.EnableMetrics;
import com.ryantenney.metrics.spring.config.annotation.MetricsConfigurerAdapter;

@Configuration
@EnableMetrics
public class CloudWatchMetricsPublisher extends MetricsConfigurerAdapter {

 @Inject
 private AmazonCloudWatchAsync amazonCloudWatchAsyncClient;

 @Override
 public void configureReporters(MetricRegistry metricRegistry) {

    MetricSet jvmMetrics = new MetricSet() {

       @Override
       public Map<String, Metric> getMetrics() {
          Map<String, Metric> metrics = new HashMap<String, Metric>();
          metrics.put("gc", new GarbageCollectorMetricSet());
          metrics.put("memory-usage", new MemoryUsageGaugeSet());
          metrics.put("threads", new ThreadStatesGaugeSet());

          return metrics;
       }
    };
    metricRegistry.registerAll(jvmMetrics);

    CloudWatchReporterFactory reporterFactory = new CloudWatchReporterFactory();
    reporterFactory.setClient(amazonCloudWatchAsyncClient);
    reporterFactory.setNamespace("MY/XYZ");

    CloudWatchMachineDimensionReporter scheduledCloudWatchReporter = (CloudWatchMachineDimensionReporter) reporterFactory
    .build(metricRegistry);

    registerReporter(scheduledCloudWatchReporter).start(1, TimeUnit.MINUTES);
 }
}
Once available in Cloudwatch, metrics data could be visualized using pre-built graphs and tables. Cloudwatch visualization capabilities can’t be compared with those of Grafana or Kibana, but they are sufficient for a lot of needs. That’s only half of what we want though. To complete the monitoring lifecycle, we need a exception detection mechanism and notify people accordingly. Enter Cloudwatch Alarms, which could be configured to monitor a metric, define a breach point, and send a notification via AWS SNS. SNS is a pub-sub service which could:
- send notifications to subscribed HTTP(S) endpoints/AWS SQS queues, or
- send emails via AWS SES, or
- send events to be processed by AWS Lambda functions.
Most of the alerting products like Hipchat, Slack, Alerta etc. provide HTTP Webhooks, which could either be invoked directly via HTTP(S) subscription to SNS, or a Lambda could act as a mediator to pre-process the Cloudwatch alarm notification. Some great examples are:
- https://github.com/rvrangel/cloudwatch-hipchat
- https://github.com/assertible/lambda-cloudwatch-slack
- http://alerta.readthedocs.io/en/latest/integrations.html#webhooks
Now, this is what a Cloudwatch alarm for JVM heap usage looks like in Cloudformation:
 "JVMHeapMemoryUsageAlarm": {
 "Type": "AWS::CloudWatch::Alarm",
 "Properties": {
 "ActionsEnabled": "true",
 "AlarmName": "Autoscaling-EC2-HighJVMHeapMemoryUsage",
 "AlarmDescription": "High JVM Heap Memory for Autoscaling-EC2 - My-XYZ",
 "Namespace": "MY/XYZ",
 "MetricName": "my_jolokia_heap_memory_usage_HeapMemoryUsage_used",
 "Dimensions": [{
       "Name": "StackName",
       "Value": {
          "Ref": "AWS::StackName"
       }
    }, {
       "Name": "VPC",
       "Value": "myvpc"
    }, {
       "Name": "jolokia_host",
       "Value": "127.0.0.1"
    }, {
       "Name": "jolokia_port",
       "Value": "8080"
    }
 ],
 "Statistic": "Maximum",
 "Period": "60",
 "EvaluationPeriods": "1",
 "Threshold": 2000000000,
 "ComparisonOperator": "GreaterThanOrEqualToThreshold",
 "AlarmActions": [{
    "Ref": "MyNotificationSNSTopic"
 }]
 }
}
Above alarm will trigger as soon as JVM heap reaches 2GB on any of the EC2 instances in Autoscaling group. Another alarm for Procstat generated metric looks like:
 "SvcProcessMonitorAlarm": {
 "Type": "AWS::CloudWatch::Alarm",
 "Properties": {
 "ActionsEnabled": "true",
 "AlarmName": "Autoscaling-EC2-JavaProcessAvailability",
 "AlarmDescription": "My XYZ Service is down for Autoscaling-EC2 - My-XYZ",
 "Namespace": "MY/XYZ",
 "MetricName": "my_procstat_pid",
 "Dimensions": [{
       "Name": "StackName",
       "Value": {
          "Ref": "AWS::StackName"
       }
    }, {
       "Name": "VPC",
       "Value": "myvpc"
    }, {
       "Name": "pattern",
       "Value": "my-xyz-boot.jar"
    }, {
       "Name": "process_name",
       "Value": "java"
    }
 ],
 "Statistic": "SampleCount",
 "Period": "60",
 "EvaluationPeriods": "1",
 "Threshold": "3",
 "ComparisonOperator": "LessThanThreshold",
 "AlarmActions": [{
    "Ref": "MyNotificationSNSTopic"
 }],
 "InsufficientDataActions": [{
    "Ref": "MyNotificationSNSTopic"
 }]
 }
 }
Above alarm will trigger as soon as Java process goes down on any of the EC2 instances (3) in Autoscaling group. If you’ve alarms for standard metrics – “GroupInServiceInstances” for Autoscaling group, and/or “UnHealthyHostCount” for Load Balancer, those will trigger a bit later than the Procstat one.
Above discussion was more around sending timely notifications in case of exceptional system situations. We can also create up/down policies depending on certain metric data – like increasing or decreasing number of instances automatically based on CPU Utilization. One could go a step further and write a custom application, which subscribes to Alarm SNS topic via HTTP(S) endpoint, and take advanced correction/preventive actions specific to an application. Possibilities are endless with the plug n’ play architecture.